03
اردیبهشت
UV-Visible spectroscopy
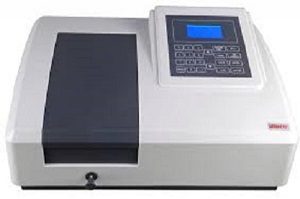
UV-Visible spectroscopy Absorption of light in the UV/Visible part of the spectrum (210 – 900 nm). • The transitions that result in the absorption of electromagnetic radiation in this region of the spectrum are transitions between electronic energy levels. • Generally, the most probable transition is from highest occupied molecular orbital (HOMO) to lowest occupied molecular orbital (LUMO). • Probes the various excited states of the system. • Light in the UV-VIS part of the spectrum is used to promote electrons from the ground state to various excited states. • The particular frequencies at which light is absorbed are effected by the structure and environment of the chromophore (light absorbing species). • Excited electrons can return to the ground state by vibrational transitions through smaller energy increments. • Absorbed energy appears ultimately as heat in solution. Interatomic distance Energy Excited electronic state Ground state Vibrational energy levels Introduction Effect of substituents on the absorption spectra • Bathochromic shift (red shift): a shift to lower energy or longer wavelength. • Hypsochromic shift (blue shift): a shift to higher energy or shorter wavelength. • Hyperchromic effect: An increase in intensity. • Hypochromic effect: A decrease in intensity. The effect of conjugation of alkene Ethylene Butadiene Hexatriene E n e r g y 175 nm 217 nm 258 nm Energies are quantized A Discreet set of energy levels Why are Cherries Red and Blueberries blue ? The Colour of Fruit This energy corresponds to Deep Red Colour If L=0.7 nm, =540 nm If L=0.6 nm, =397 nm Green Colour Blue Colour Estimating pigment length Assumptions: Wavelength of transition for Anthracene Particle in a Box Simple model of molecular energy levels. Anthracene L L 6 A p electrons – consider “free” in box of length L. Ignore all coulomb interactions. Pigments and Quantum mechanics • Electrons have wave properties and they don’t jump off the pigments when they reach its ends. • These electrons resonances determine which frequencies of light and thus which colors, are absorbed & emitted from pigments High degree of conjugation!! Experimental Set Up • Various designs of spectrophotometers : Fixed and variable wavelength; Single, split and double beam • Cuvettes: Glass or plastic – visible Quartz – visible, UV Acrylic – visible, UV Light source Monochromator Cuvette with sample Detector I0 I Monochromator Monochromator Instrumentation Absorbance and the Beer – Lambert Law According to the Beer-Lambert Law, absorbance is proportional to concentration, and Absorbance versus concentration plot is a straight line. Deviation from Lambert’s Beer Law p n p Electronic levels and transitions p p n p n p Occupied levels Unoccupied levels σ→σ* Alkanes σ→π* Carbonyl compounds π →π* Alkenes, carbonyl compn, alkyne etc. n→σ* Oxygen, nitrogen, sulfur and halogen compounds n →π* Carbonyl compounds Typical absorptions of simple chromophores Class transition Wavelength max (nm) R-OH n→σ* 180 R-O-R n→σ* 180 R-NH2 n→σ* 190 R-SH n→σ* 210 R2C=CR2 π →π* 175 R-C≡C-R π →π* 170 Typical absorptions of simple chromophores Class transition Wavelength max (nm) R-CHO π →π* 190 n →π* 290 R2CO π →π* 180 n →π* 280 RCOOH n →π* 205 R-COOR’ n →π* 205


